
The Investigation of the MCI Effectiveness on Randolph Avenue Bridge

Prof. Dubravka Bjegović, Ph. D., University of Zagreb, Civil Engineering Faculty, Zagreb, Croatia
Jessica Jackson, Cortec Corporation, St. Paul, MN, USA
Richard D. Stehly Ph.D., American Engineering Testing, St. Paul, MN, USA
ABSTRACT
The bridge deck of the Randolph Avenue Bridge in St. Paul, Minnesota, was rehabilitated in 1986. The rehabilitation process included the application of an LSDC overlay to the two eastbound traffic lanes and the application of an LSDC overlay that included the corrosion-inhibiting admixture, MCI, to the two westbound traffic lanes.
In this paper the results of corrosion rates, electrochemical potential, chloride contamination level, concrete resistivity, ambient temperature and relative humidity of both the eastbound and westbound lanes on Randolph Avenue Bridge are given. The purpose of this investigation was to determine if MCI does indeed have a positive effect on the rate of corrosion, fourteen years after the rehabilitation.
The westbound lanes, treated with corrosion inhibitor, have lower half — cell potentials, lower corrosion rates readings, lower chloride levels and higher concrete resistivity than the eastbound lanes. This investigation shows positive effect of migration corrosion inhibitor as the method for reinforced concrete corrosion protection.
KEYWORDS: concrete, corrosion, corrosion-inhibiting admixture, effectiveness, reinforcing steel
INTRODUCTION
One of the main causes of reinforced concrete deterioration is the steel corrosion. The deterioration of reinforced concrete structures is connected with enormous costs and therefore the development of accurate corrosion protection methods is of the greatest importance. One of the possible methods is the application of migrating corrosion inhibitors (MCI).
MCI inhibitors are secondary electrolyte layer mixed inhibitors. Substances dispersed or dissolved in the electrolyte-layer cause electrolyte-layer inhibition. MCI possess appreciable saturated vapor pressures under atmospheric conditions, thus allowing significant vapor phase transport of the inhibitive substance (1). MCIs are a mixed (anodic /cathodic) amino-carboxylate based inhibitor system. The inhibition of cathodic process is achieved by incorporation of one or more oxidizing radicals in an organic molecule. Inhibitor molecules are hydrolyzed in the electrolyte and then adsorbed on the metal surface. The nitrogen of the amine group is capable of entering into a coordinate bond with metal thus enhancing the adsorption process. Adsorption of cations increases the over potential of metal ionization and slows down the corrosion. The monomolecular film serves as a buffer to hold the pH at the interface in the optimum range for corrosion resistance. MCI migrate or transport through concrete to the rebar depending on the MCI type and application method: MCI admixture type migrates to the reinforcement by diffusion (both liquid and vapor) and MCI topical application type migrates to the reinforcement first by capillary suction and than by diffusion (both liquid and vapor) (2).
Bjegović et all (3) suggest an approach to the migration corrosion inhibitor testing as the procedure in four steps: step I - the electrochemical methods, as a preliminary testing, step II - methods according the Japanese standard JIS A 6205, as an accelerated test, step III - long-term laboratory testing according to ASTM G 109 and step IV — field monitoring. A lot of laboratory testing has been still done worldwide (4). Only some field testing are in progress now.
One of such field testing was done on Randolph Avenue Bridge. The corrosion rates, electrochemical potential, chloride contamination level, concrete resistivity, ambient temperature and relative humidity of both the eastbound and westbound lanes on Randolph Avenue Bridgewere tested. The purpose of the investigation was to determine if MCI does indeed have a positive effect on the rate of corrosion, fourteen years after the rehabilitation.
In 1986, the deck of the bridge that carries Randolph Avenue over I-35E in St. Paul, Minnesota, was rehabilitated. The rehabilitation process included the application of a Low Slump Dense Concrete (LSDC) overlay. Migrating corrosion inhibitor was added to the LSDC at 1 lb/yd3(0.6 kg/m3) for the two westbound traffic lanes. Prior to overlay, the deck was milled to a depth of 0.5 in (13 mm) and the areas of unsound concrete were removed. The cavities from the removal of the unsound concrete were filled with the overlay concrete.
Corrosion assessments were conducted on the eastbound (control) and westbound (with MCI applied) travel lanes of the structure on two occasions, June 1991 and August 1992. The assessments included visual inspection, delamination survey, cover-depth survey, chloride contents as a function of depth, corrosion potentials, and estimates of corrosion current densities (icorr). SHRP-S-658 contains all information from the 1991 and 1992 study. In November 2000 new measurements has been done on the bridge. These included Gecor 6 readings and copper/copper sulfate half-cell potentials. A new chloride analysis was also taken at various depths. This paper contain data obtained from 1985 to 2000.
EXPERIMENTAL PROCEDURE
Half-Cell Potentials
ASTM C 876 corrosion half-cell potentials were measured for both the eastbound and westbound travel lanes with a copper/copper sulfate electrode (CSE) before reconstruction in 1985 and after from 1986 to 2000, five, six and fourteen years, respectively after reconstruction; and with Gecor 6 in November of 2000.and are given in Table 1.The results of the measurements in 2000 are shown in Fig.1. According to ASTM: C876, the results can be interpreted as follows in Table 2.
Table 1. East and Westbound Randolph St. Bridge Deck Half-Cell Potential and Gecor 6 Readings
|
East and Westbound Randolph St. Bridge Deck Half-Cell Potential and Gecor 6 Readings |
|||||||||
|
Years Service |
Average |
Std.Dev. |
Minimum |
Maximum |
%>350 mV |
Testing Firm |
|||
| Control |
1985 |
256 mV |
93 |
120 mV |
620 mV |
13 |
MN - DOT |
||
| MCI |
292mV |
115 |
150 mV |
650 mV |
24 |
MN - DOT |
|||
| Control |
1986 |
100 mV |
53 |
000 mV |
270 mV |
0 |
MN - DOT |
||
| MCI |
141 mV |
48 |
030 mV |
300 mV |
0 |
MN - DOT |
|||
| Control |
1987 |
292 mV |
59 |
157 mV |
444 mV |
15 |
MN - DOT |
||
| MCI |
302mV |
52 |
180 mV |
479 mV |
18 |
MN - DOT |
|||
| Control |
1988 |
299 mV |
49 |
204 mV |
466 mV |
12 |
MN - DOT |
||
| MCI |
270 mV |
50 |
161 mV |
485 mV |
5 |
MN - DOT |
|||
| Control |
1989 |
177 mV |
64 |
037 mV |
527 mV |
2 |
MN - DOT |
||
| MCI |
139 mV |
56 |
009 mV |
344 mV |
0 |
MN - DOT |
|||
| Control |
1990 |
276 mV |
73 |
162 mV |
574 mV |
15 |
MN - DOT |
||
| MCI |
238 mV |
59 |
133 mV |
512 mV |
4 |
MN - DOT |
|||
| Control |
1991 |
149 mV |
64 |
195 mV |
237 mV |
6 |
VA TECH |
||
| MCI |
179 mV |
55 |
170 mV |
235 mV |
2,3 |
VA TECH |
|||
| Control |
1992 |
231 mV |
64 |
217 mV |
236 mV |
NA |
VA TECH |
||
| MCI |
184 mV |
50 |
173 mV |
236 mV |
NA |
VA TECH |
|||
| Control |
2000 |
248 mV |
54 |
134 mV |
407 mV |
4 |
AET |
||
| MCI |
222 mV |
55 |
145 mV |
360 mV |
1,4 |
AET |
|||
|
Gecor 6 readings |
|||||||||
| Control |
2000 |
269 mV |
67 |
175 mV |
414 mV |
12 |
AET |
||
| MCI |
209 mV |
51 |
144 mV |
333 mV |
0 |
AET |
|||
Table 2. Criteria for corrosion potential measurement
|
Potential |
Probability of Corrosion |
|
>-200 mV |
Less than 10% |
|
-200 mV to -350 mV |
50% |
|
>-350 mV |
Greater than 90% |
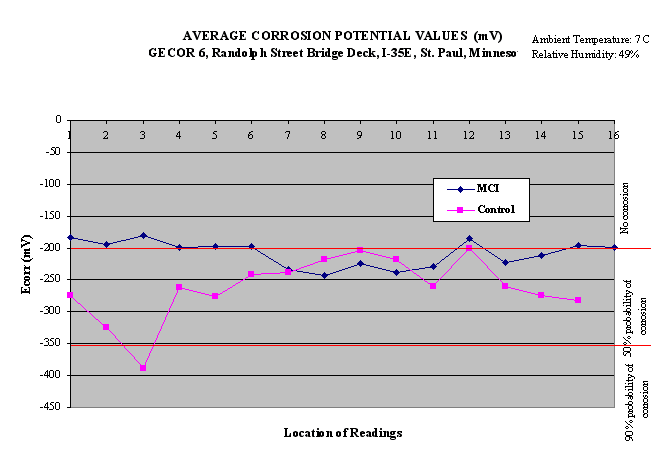
Fig.1. Corrosion potential measurements in 2000 year
Corrosion Current Measurements
Corrosion current density (icorr) estimates were taken with the Gecor 6 device in November 2000. These same estimates were taken in June 1991 and August 1992 using a 3LP device. The icorr measurement using the 3LP device is proportional to the corrosion rate through Faraday’s Law. The Gecor 6 measures the corrosion rate of steel in concrete by "polarization resistance" or "linear polarization" techniques. This is a non-destructive technique that works by applying a small current to the rebar and measuring the change in the half-cell potential. Then the polarization resistance, Rp, (the change in potential measured by Gecor 6), is divided by the applied current. The Gecor 6 obtains the corrosion rate, icorr, from the polarization resistance, Rp, by means of the "Stearn and Geary" relationship:
icorr = B/Rp, where B = 26 mV (1)
The criteria for estimating the reinforcement’s condition in relation to the measured value of the rate of corrosion have been defined as follows in Table 3.
The results of the measurements obtained from 1991 to 2000 are shown in Table 4 and only for 2000 but for different location are shown in Fig.2.
Table 3. Criteria for corrosion rate
|
Icorr |
Intensity of Corrosion |
|
<0.1 to 0.2 µA/cm2 |
Passive condition |
|
0.2 to 0.5 µA/cm2 |
Low to moderate corrosion |
|
0.5 to 1.0 µA/cm2 |
Moderate to high corrosion |
|
>1.0 µA/cm2 |
High corrosion rate |
Table 4. Corrosion rates measurements from 1991 to 2000.
|
Statistical Parameter |
Icorr (mA/ft2) |
|||||||
|
Eastbound, LSDC Control |
Westbound,LSDC/Cortec MCI 2000 |
|||||||
|
1991* |
1992* |
2000** |
1991* |
1992* |
2000** |
|||
| Mean |
1,53 |
0,74 |
0,02 |
1,83 |
0,51 |
0,012 |
||
| Standard Deviation |
0,45 |
0,2 |
0,01 |
1,44 |
0,18 |
0,008 |
||
| Number Observati. |
11 |
12 |
32 |
11 |
6 |
41 |
||
|
*Taken with 3LP meter |
**Taken with Gecor 6 |
|||||||
|
1m A/cm2 = 0.929 mA/ft2 |
||||||||
Concrete Resistivity Measurements
Concrete resistivity measurements were also taken using Gecor 6 device and concrete resistivity was calculated by means of the formula:
Resistivity = 2 * R * D, where (2)
R = resistance by the "iR drop" from a pulse between the sensor counter-electrode and the rebar network
D = counter-electrode diameter of the sensor
The value of the concrete’s resistance is used as an additional parameter for the interpretation of the rate of corrosion. The interpretation of the results is possible according the criteria by Andrade et all (5,6) given in Table 5. The results of the measurements obtained only in 2000 year are shown in Fig.3.
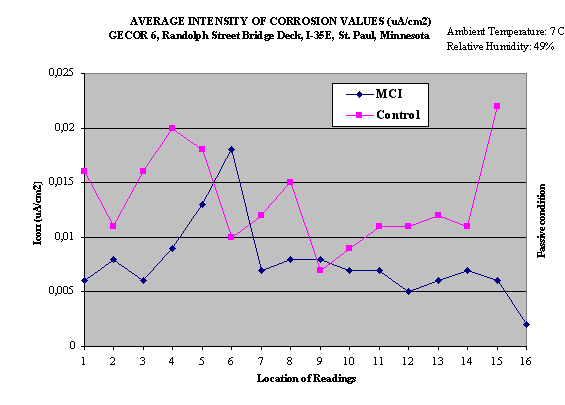
Fig.2. Corrosion rate measurements in 2000 year
Table 5. Criteria for Concrete Resistivity
|
Resistivity |
Corrosion Rate |
|
>100 to 200 kW · cm |
Very low, even with high chloride and carbonation |
|
50 to 100 kW · cm |
Low |
|
10 to 50 kW · cm |
Moderate to high where steel is active |
|
<10 kW · cm |
Resistivity is not the parameter controlling corrosion rate |
A graph of the corrosion current and resistance (Icorr-R) results should be used so as to avoid wasting results. Andrade et al (6) recommend that criteria for the estimation of the intensity of corrosion should be used as shown in Fig. 4 in which the real results from the Randolph Avenue Bridge investigation are also given.
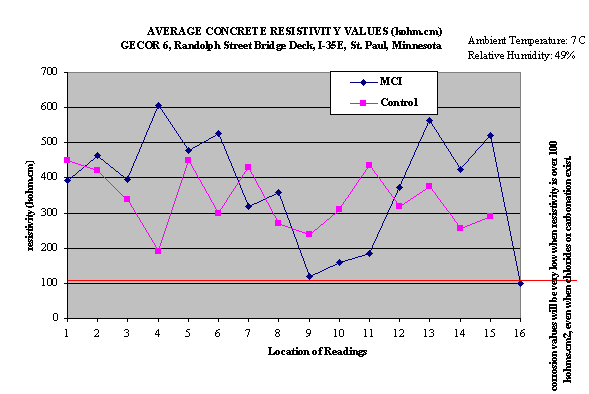
Fig.3. Concrete resistivity measurements in 2000 year
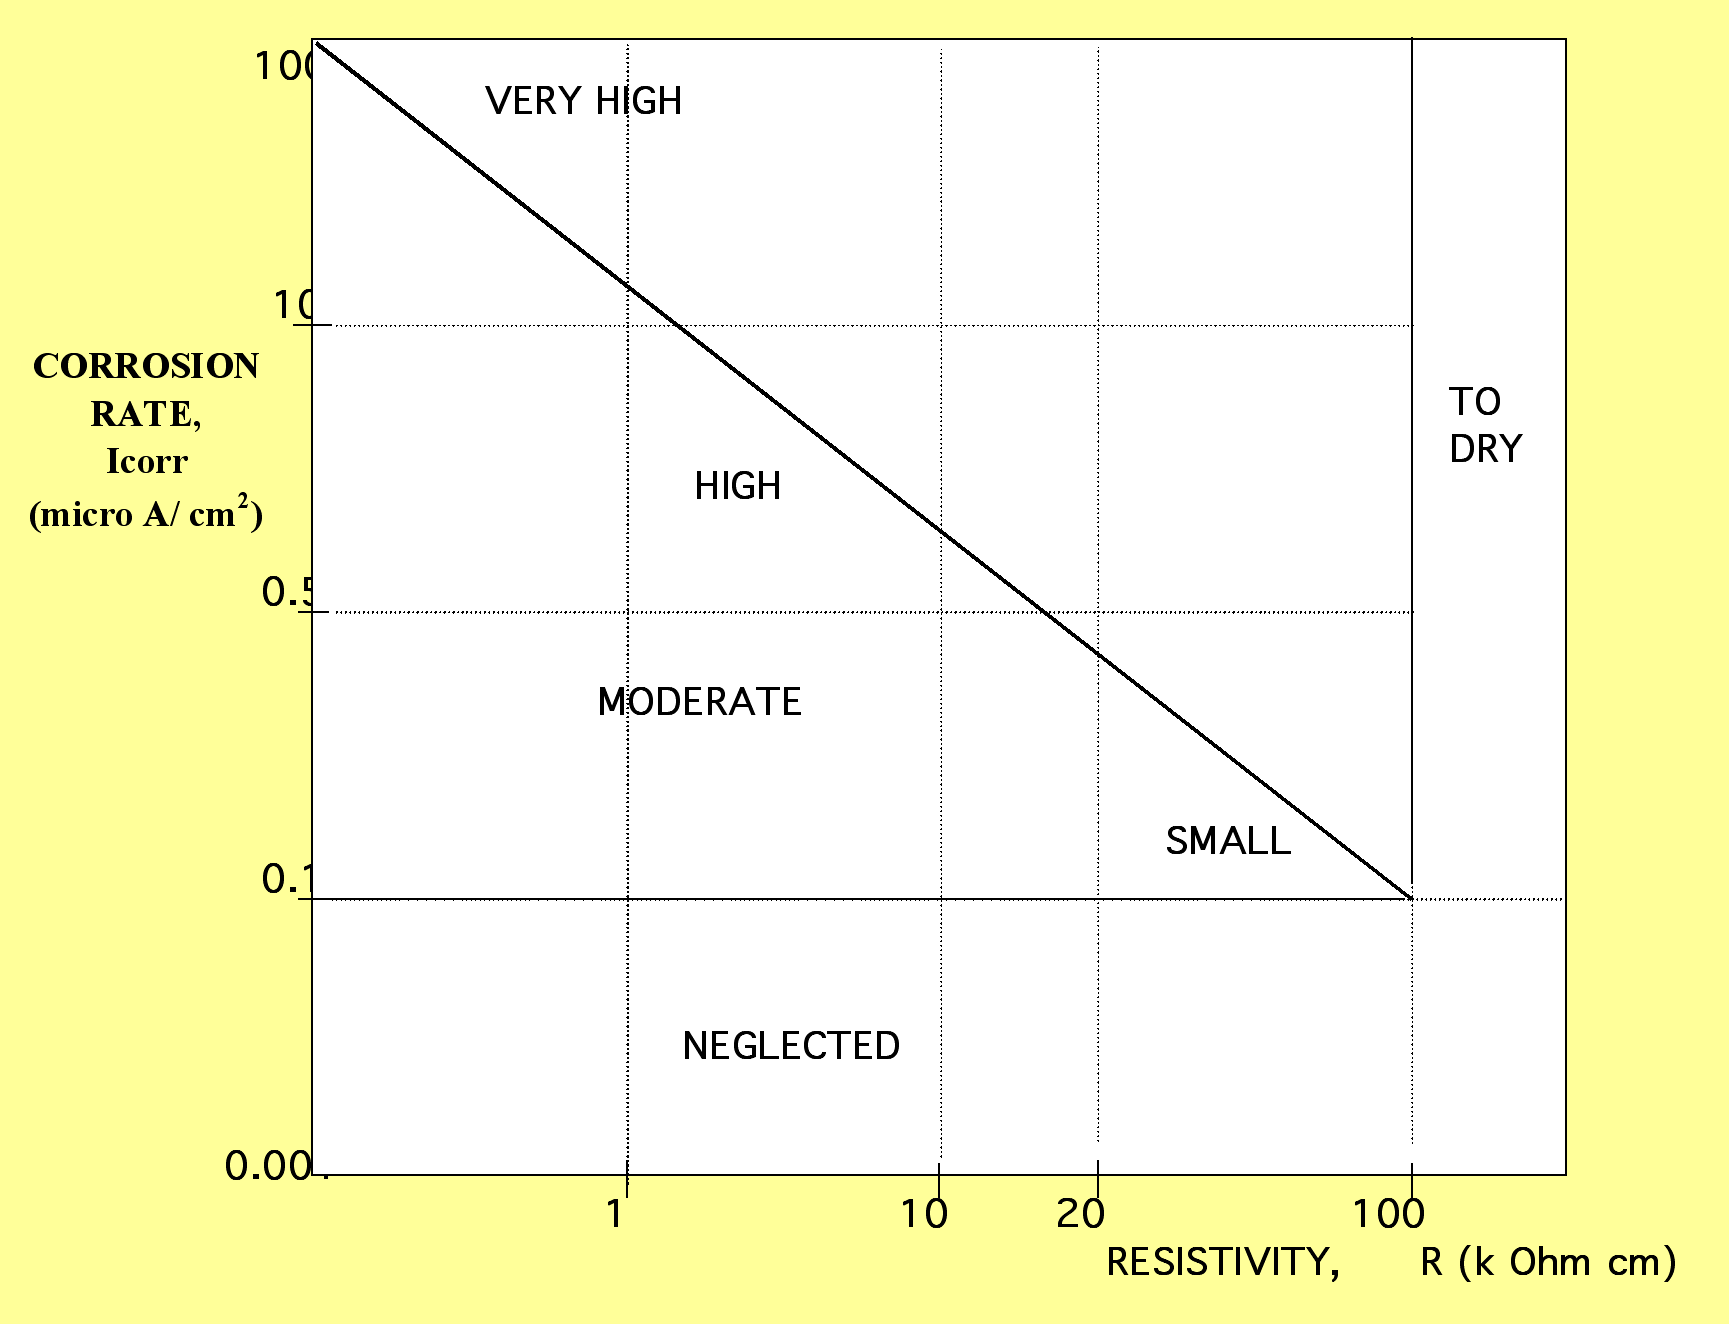
Fig.4. Corrosion rate and resistivity relationship
When the research results of a structure are described in a graph such as in Fig. 4., it should be expected that, if corrosion is active, the points of the graph follow the main line and should be in harmony with the degrees of saturation of the concrete structure.
Chloride Contamination Levels
Powdered concrete samples for chloride analysis were taken at mean depths of 1.0, 2.0, and 3.0 in (25, 51, and 76 mm) from 3 different locations on each side of the bridge in 1991, 1992 and 2000. Samples were taken using a rotary impact type drill with a _" sized bit. Three-gram samples that passed through a #20 sieve were obtained from each depth. The powder was then mixed with 20 ml of digestion solution for a total of 3 minutes and then 80 ml of stabilizing solution was added. A calibrated electrode coupled to an Orion Model 720-pH/ISE meter was then immersed in the solution, and the chloride-ion concentration was recorded. This method was consistent with the AASHTO: T260 procedure. The standard deviation for this chloride test was determined by testing the six pulverized concrete Quality Assurance (QA) samples of known chloride content. Each QA sample was tested five times. The results are given in Tables 6 and 7.
Table 6. Chloride — Ion Content (lbs/yd3) for Eastbound lanes, LSDC control
(1991&1992 data: Virginia Technology; 2000 data: American Engineering Testing)
|
Depth |
1991 |
1992 |
2000 |
|||
|
(in)* |
mean |
s x |
mean |
s x |
mean |
s x |
|
0.5 |
10.7 |
2.4 |
13.7 |
3.4 |
- |
- |
|
1.0 |
4.7 |
2.3 |
5.7 |
2.9 |
17.2 |
1.8 |
|
1.5 |
2.2 |
1.8 |
3.0 |
1.8 |
- |
- |
|
2.0 |
2.7 |
0.9 |
4.0 |
2.0 |
6.2 |
0.6 |
|
2.5 |
2.3 |
1.4 |
3.0 |
2.0 |
- |
- |
|
3.0 |
1.4 |
1.6 |
1.9 |
1.8 |
2.4 |
0.4 |
|
3.5 |
0.3 |
0.4 |
- |
- |
- |
- |
(1991&1992 data: Virginia Technology; 2000 data: American Engineering Testing)
*1 in = 2,54 cm
In 1991 chloride content was 40% less than the control. The chloride levels increased at all levels in 1992 and 2000.
According to the LIFE-365 Service Life Prediction model (7), and on the basis of the data from chloride content in concrete overlay, Fig. 5. and the LSDC mix design for Randolph Avenue Bridge Overlay, Table 8. the calculation for time until chloride threshold is reached was done and given in Table 9.
Table 7. Chloride — Ion Content (lbs/yd3) for Westbound lanes, LSDC/ MCI 2000
(1991&1992 data: Virginia Technology; 2000 data: American Engineering Testing)
|
Depth |
1991 |
1992 |
2000 |
|||
|
(in)* |
mean |
s x |
mean |
s x |
mean |
s x |
|
0.5 |
6.0 |
2.2 |
9.6 |
1.8 |
- |
- |
|
1.0 |
1.1 |
1.3 |
3.3 |
1.5 |
11.7 |
0.9 |
|
1.5 |
0 |
0.1 |
1.2 |
1.3 |
- |
- |
|
2.0 |
0 |
0 |
1.0 |
1.1 |
1.6 |
0.5 |
|
2.5 |
0.4 |
0.6 |
1.3 |
0.9 |
- |
- |
|
3.0 |
1.0 |
0.9 |
2.5 |
1.0 |
1.3 |
0.2 |
|
3.5 |
0.9 |
0.8 |
- |
- |
- |
- |
(1991&1992 data: Virginia Technology; 2000 data: American Engineering Testing)
*1 in = 2,54 cm
a) Eastbound lanes, LSDC Control b) Westbound lanes, LSDC/ MCI 2000
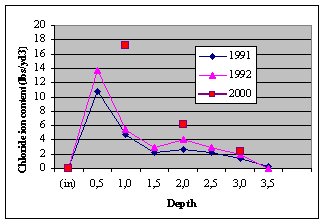
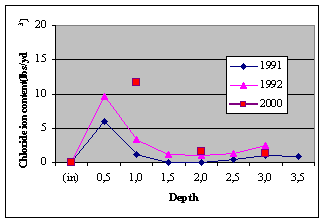
Fig. 5. Chloride contamination levels
| Table 8. LSDC Mix Design for Randolph Avenue Bridge Overlay | |||||
| Component |
SSD lbs/yd3 |
||||
| Type I Cement |
836 |
||||
| Water |
270 |
||||
| Design w/c |
0,32 |
||||
| Coarse Aggregate |
1385 |
||||
| Fine Aggregate |
1374 |
||||
| Water Reducing Admixture, PDA25YL |
32.0 oz |
||||
| AEA, Protex |
9.3 oz |
||||
| Note: 1 lb/yd3 = 0.59 kg/m3, 1 oz = 28.4 g | |||||
Table 9. Calculation for time until chloride threshold is reached
| Control | ||||||
| 2.4 lbs/yd3 chlorides at 3" 14 years after overlay was placed. 836 lbs/yd3 of cement in mix design. | ||||||
| 2.4 / 836 * 100 = 0.29% Cl- by weight of cement in 14 years. | ||||||
| 0.29% / 14 = 0.02% Cl- per year * 19.5 years = 0.40% Chlorides = chloride threshold | ||||||
| 1986 + 19.5 = 2005.5 (year we expect chloride threshold to be reached in control concrete) | ||||||
| MCI | ||||||
| 1.3 lbs/yd3 chlorides at 3" 14 years after overlay was placed. 836 lbs/yd3 of cement in mix design. | ||||||
| 1.3 / 836 * 100 = 0.16% Cl- by weight of cement in 14 years. | ||||||
| 0.16% / 14 = 0.011% Cl- per year * 36 years = 0.40% Chlorides = chloride threshold | ||||||
| 1986 + 36 = 2022 (year we expect chloride threshold to be reached in MCI treated concrete) | ||||||
| (*uses 0.40% of chlorides by weight of cementious materials.) | ||||||
Conclusion
The LSDC (Low Slump Dense Concrete) has done an excellent job at reducing the corrosion rate of the steel on both the control and MCI treated sides by reducing the diffusion of chlorides into the concrete. The conditions of the concrete on the bridge were wet and cool, taken after a period of cold weather and rain for several days. This was because the readings with the Gecor 6 are more accurate regarding the corrosion rate in wet conditions. While the LSDC has done an excellent job at protecting the reinforcing steel from corrosion on both sides of the bridge, a difference between readings taken on the control and MCI treated sides can still be seen:
- The average copper/copper sulfate potential value for rebar embedded in the MCI treated overlay was 208.9 mV, 22% less than the average for the control overlay at 269.6 mV. Also, 12% of the readings taken on the control overlay indicated corrosion, while none did on the MCI treated side.
- Rebar on the MCI 2000 treated side had very low corrosion currents, an average of 0.013 m A/cm2, approximately 40% below readings taken on control side (average of 0.022 m A/cm2).
- The reduced chloride diffusion can be seen when looking at the data from American Engineering Testing. After fourteen years, the chloride concentration at three inches (76 mm) of depth (near the rebar) is 1.42 kg/m3 on the control side and 0.77 kg/m3 on the MCI treated side.
- According to the LIFE-365 Service Life Prediction model, the chloride threshold (Ct) is 0.05%, this value is commonly used for service-life prediction purposes and is close to a value of 0.40% chloride based on the mass of cementitious materials for a typical structural concrete mix. This is the level of chlorides at which corrosion of the reinforcing steel is initiated. It is estimated that the control will reach 0.05% of chlorides at the rebar in 19.5 years from the application of the overlay, or in the year 2005, if the chloride level continues to increase at its current rate. The MCI 2000 treated side is estimated to reach 0.05% of chlorides in 36 years from the application of the overlay, or in the year 2022.
REFERENCES
- Miksic, B.A., (1983), Use of Vapor Phase Inhibitors for Corrosion Protection of Metal Products, NACE Corrosion 83, Paper No. 308, Anaheim, California.
- Bjegović, D., Sipos, L., et al., (1994), Diffusion of the MCI 2020 and 2000 Corrosion Inhibitors into Concrete, International Conference on Corrosion and Corrosion Protection of Steel in Concrete, Sheffield, 865-877.
- Bjegović, D., Mik_ić, B., Stehly, R., (2000), Test Protocols for Migrating Corrosion Inhibitors (MCITM) in Reinforced Concrete, in Emerging Trends in Corrosion Control — Evaluation, Monitoring, Solutions, published by: Akademia Books International, New Delhi, 3-18.
- COST 521: Corrosion of Steel in Reinforced Concrete Structures, Prevention — Monitoring — Maintenance, Final Report 2002, edited by Romain Weydert, published at IST — Luxembourg University of Applied Sciences, pp 254.
- Andrade, C., Alonso, M.C., Gonzalez, J.A., "An Initial Effort to Use the Corrosion Rate Measurements for Estimating Rebar Durability", Corrosion Rates of Steel in Concrete, ASTM STP 1065.
- Andrade, C., Fullea, J., Alonso, C., "The Use of the Graph Corrosion Rate-Resistivity in the Measurement of Corrosion Current", International Workshop MESINA, Instituto Eduardo Torroja, Madrid, Spain, 1999.
- Thomas, M.D.A. and Bentz, E.C., Life-365 Computer Program for Predicting the Service Life and Life-Cycle Costs of Reinforced Concrete Exposed to Chlorides. University of Toronto, Toronto, Canada, April 21, 2000, pp. 9.